Research Article | | Peer-Reviewed

Application of Statistical Thermodynamics to Modelling Fluid Discharge Through a Circular Orifice System

Received: 29 November 2024     Accepted: 7 January 2025     Published: 24 January 2025
Views:       Downloads:
Abstract

This study presents the application of statistical thermodynamics in modeling orifice discharge function. Micro-based variables such as the velocity of fluid flow at the midpoint of the reservoir elevated to the mid-height of the orifice and the head loss due to sudden expansion that was neglected in the classical discharge model were considered in the modeling operation. Bernoulli’s equation was used to determine the velocity model at the exit point of the orifice. Some classical thermodynamic models were used to compute certain parameters like: the flow pressure of fluid (water) (Pf), pressure drop (Pd), exit temperature, polytropic work (W), heat absorption/rejection (Q), and flow energy (E). The grand canonical ensemble which applies to open systems was used to establish a relationship between the flow discharge and energy variables according to the micro-based behavior of fluid flow through the orifice that generates the observable macro-flow behavior of a fluid. The discharge values obtained using the experimental (Qe), classical (Q(c,)) and statistically derived orifice discharge (Qs) models were compared and accessed statistically using the indices of: mean bias error (MBE), mean percentage error (MPE), root mean square error (RMSE), Nash-Sutcliffe equation (NSE), and coefficient of correlation (R). The results of the study showed that the new model that was derived using a statistical thermodynamics approach outperformed the classical orifice model as its MBE value of 5.032E-05, MPE of 5.62, RMSE of 5.24E-05, NSE of 0.873 and R of 0.999 were all better than that of the classical model having an MBE value of -1.0042E-04, MPE of -11.30 (underestimation), RMSE of 5.814E-05, and R of 0.999. In addition, the values of Pf, T2, W, Q, and E increased as the flow head increased. The polytropic work, W was negative, indicating that the system did some work. The positive values of Q and E showed that the system absorbed energy from its environment during the fluid flow operation. Furthermore, all the orifice discharge functions (Qs, Q(c) and Qe) had a direct linear relationship with flow energy, E which therefore satisfied the grand canonical ensemble model for the open system’s thermodynamic micro-variable description. Hence, the new orifice discharge model is recommended for the industry's volumetric flow rate measurement of Newtonian fluids.

Published in American Journal of Mechanical and Industrial Engineering (Volume 10, Issue 1)
DOI 10.11648/j.ajmie.20251001.11
Page(s) 1-11
Creative Commons

This is an Open Access article, distributed under the terms of the Creative Commons Attribution 4.0 International License (http://creativecommons.org/licenses/by/4.0/), which permits unrestricted use, distribution and reproduction in any medium or format, provided the original work is properly cited.

Copyright

Copyright © The Author(s), 2025. Published by Science Publishing Group

Keywords

Classical Thermodynamics, Discharge, Grand Canonical Ensemble, Orifice, Statistical Thermodynamics

1. Introduction
An orifice according to is an opening in the wall or base of a vessel through which a fluid passes. Essentially, an orifice is characterized by its top edge that is always below the free surface, otherwise a weir is developed. In the flow regime through an orifice, the discharge model has several unconsidered parameters that were assumed fixed during the model formulation. Some of these parameters include: section velocity due to head loss after sudden expansion at the vena contracta, velocity at the vena contracta, area of the vena contracta, fluid velocity before the vena contracta zone, etc. This study aims at re-modeling the flow discharge function by considering these microscopic constitutive parameters that describe the macro-flow behaviors of incompressible fluids through orifices using the tool of statistical mechanics and kinetic functions. Kinetic functions, it implies the mechanical motions of the fluid system. The flow pattern through a small circular orifice is presented in Figure 1.
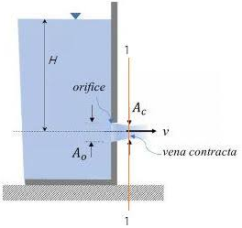
Figure 1. Pictorial representation of flow through an orifice.
Statistical thermodynamics (also referred to as statistical mechanics) deals with the application of probability theory (which has content tools for studying large populations) to examine and analyze the microstates that constitute the microstates of the system under study. In other words, it provides a molecular-level description of the macroscopic behaviors of systems using indices such as work, heat, Gibbs free energy, enthalpy, entropy, etc. Statistical thermodynamics is described to be composed of two fundamental concepts- statistical mechanics and kinetic theory, though the two sub-divisions were founded based on similar axiomatic structures . Statistical mechanics is based on the concept that the equilibrium state of a thermodynamic medium is the macroscopic state corresponding with the most probable microscopic state, while the kinetic theory takes into account definite molecular models and mechanical parameters.
Orifice systems are classified based on size, shape, upstream edge, and discharge conditions; by size, we have small and large orifices; by shape, we have circular, rectangular, square, and triangular orifices; by upstream edge, we have sharp-edged orifice and bell-mounted orifice; and by discharge conditions we have, free, drowned or submerged, fully submerged and partially submerged orifices . Based on the wide areas of application of the orifice system, lots of studies have been carried out to understand several governing parameters of the orifice system, and the response behavioral patterns of the orifice system when subjected to certain conditions. The results of the experimental and numerical investigation of the silo orifice discharge for a cohesive granular material were presented by . The study employed experimental and numerical techniques in studying the effects of the cohesive length on the discharge parameter of a silo orifice for two distinct configurations- asymmetrical and quasi-2D rectangular silo. An adjustable bottom was used in both configurations to control the size of the orifice. The study results showed a modification of the scaling laws, which occurred when the cohesive length became higher than the diameter of the grains. The obtained results suggest that the cohesive length acts like an effective grain diameter once the cohesion becomes sufficiently strong. Also, Hotupan and Hadarcan carried out a study on the experimental determination of the discharge coefficient through a circular orifice in PVC pipes. They obtained experimentally, discharge coefficient values of the range 0.59-0.86 which is per the results of related studies. In addition, Assran et al performed a study on the effect of orifice-meter shape on discharge coefficient and head loss through it. The results obtained from the study summarily showed that orifices with triangular geometry have higher performances with a lower head loss and a higher coefficient of discharge when compared to the other orifice shapes. Furthermore, orifice parameters such as orifice diameter, plate thickness, and liquid head were correlated, and a semi-empirical model for orifice coefficient determination and an empirical model with high precision at the stable zone was developed in the study . It has been deduced that large orifice diameters or water heads possess small discharge coefficients and that the diameter of the orifice has a more significant effect on the discharge coefficient than the water head .
Therefore, the present study centered on the application of statistical thermodynamics in remodeling the orifice discharge function by considering some micro-based variables that constitute the macro-behavior of incompressible fluids flowing through the orifice system. The study considered a circular orifice system, and it also compared statistically, the discharge values obtained with the newly developed model and the conventional/classical orifice discharge model.
2. Theoretical Background
Statistical thermodynamics deals with the application of micro-based variables which were probably neglected at the macro-state to model and understand the thermodynamic behaviors of various engineering systems. In the conventional classical orifice equation (expressed in equation 1) which is used to determine the volumetric discharge through an orifice system, some micro-based variables such as head loss due to sudden expansion (Hc) and the velocity at point 1 (V1) of Figure 2 were ignored. So, there is a need to remodel the equation using Bernoulli’s equation and have the discharge estimation performances of both the classical and statistical-based models compared and evaluated. Bernoulli’s equation, which is expressed in equation 2 was deployed in the remodeling operation as it accurately helps in analyzing and describing fluid flow systems’ characteristics within any two points of the flow regime. Therefore, Bernoulli’s model is best suited to the concept of this study. Moreso, classical thermodynamics models were employed in studying some essential variables like flow pressure, exit temperature of the fluid at the orifice point, flow energy, flow head, polytropic flow work, and heat absorption/rejection of the flow system through a circular orifice. The applied classical thermodynamics models are expressed in equations 36-40 of this study.
3. Materials and Method
3.1. Materials
The materials used during the experimental phase of this study were: 20mm uPVC pipe, a cylindrical tank measuring 550mm in diameter, a digital stopwatch, steel tape, a vernier caliper (0-25mm), and a 60-liter cylindrical vessel.
3.2. Method
The methods adopted in this study were experimental and numerical techniques. The experimental method aided in the obtainment of actual discharge values which were then compared with the classical and new discharge models using some statistical evaluation metrics like: mean bias error (MBE), mean percentage error (MPE), root mean square error (RMSE), Nash-Sutcliffe equation (NSE) and coefficient of correlation (R). Figure 2 shows the geometric model of the orifice system used in the numerical modeling.
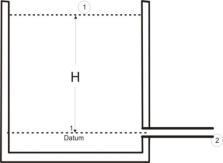
Figure 2. Geometric model of the circular orifice system.
Some micro-based variables such as head loss due to sudden expansion and the velocity at point 1 of Figure 2 that were neglected in the classical orifice discharge model expressed in equation 1 were all considered in the new model proposed in this study. These micro-based variables cumulatively determine the macro-behaviors of incompressible fluid flow through an orifice system.
Qc= CdA2gH(1)
Where:
Cd = discharge coefficient (0.75) ,
A = area of orifice,
H = height above the orifice = pressure head,
g = acceleration due to gravity.
3.2.1. Numerical Modeling of Orifice Flow Discharge Function
With reference to Figure 2, applying Bernoulli’s equation to the system as expressed in Equation 2.
 P1ω +H1+ V122g+HG=P2ω +H2+ V222g+HL(2)
Where:
P1 = fluid pressure at point 1,
P2 = fluid pressure at point 2,
H = H1 = Elevation at point 1 above datum (m)
H2 = elevation at point 2 (at datum point) = 0
V1 = fluid velocity (m/s) at point 1
V2 = fluid velocity (m/s) at point 2
g = gravitational acceleration (m/s2)
HG = head gain, such as from a pump (m)
HL = combined head loss (m)
The fluid pressures, P1and P2 are atmospheric, hence taken as 0; HG = 0 since no pump was installed.
Substituting these values into equation 2, we have,
+V122g =V222g+ HL(3)
Making V2 the subject formula in equation 3, we have,
V22=V12+2g(H-HL)(4)
The head loss visible at the orifice is at point “2”, loss due to sudden contraction (HC) as shown in figure 3. Therefore, HL = HC. Therefore, equation 4 becomes;
 V22=V12+2g(H-HC)(5)
For the case of sudden contraction at the orifice section, figure 3 was used for the analysis of flow parameters.
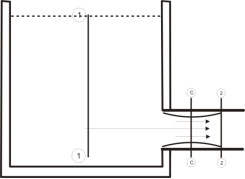
Figure 3. Fluid flow through sudden contraction region.
The loss of the head is confined between sections C-C to sections 2-2. Section C-C is the vena contracta. In calculating for sudden contraction, the section between C-C and 2-2 is considered. Sections 1 and C-C are not considered because pressure distribution cannot be accurately described. It can be said that the losses due to contraction are not for the contraction itself, but due to the expansion followed by the contraction.
Let A1 = Area at section 1
P1 = Pressure at section 1
V1 = Velocity at section 1
AC, PC, VC, and A2, P2, and V2 are corresponding values at sections C-C and 2-2 respectively.
From the continuity equation of incompressible fluids;
A2V2=ACVC(6)
VC= A2V2AC(7)
Where AC and VC are the area and velocity at the contraction point.
Head loss due to sudden expansion is expressed in equation 8 ;
He= V1-V22g2(8)
Hence, head loss (HC) due to sudden contraction as shown in Figure 3. becomes;
HC= VC-V22g2(9)
Substitute equation 7 into 9, we have,
HC= A2V2AC - V22g2(10)
HC= A2V2-ACV22gAC22(11)
HC= A2V22 -2ACA2 V22+ ACV222gAC2 (12)
Substituting the value of HC into equation 6,
V22=V12+2g- A2V22 -2ACA2V22+ ACV222gAC2(13)
V22=V12+2g2gAC2-A2V22 +2ACA2V22- ACV222gAC2(14)
V22=V12+2gH- A2V22AC2+2A2V22AC-  V22(15)
V22+ A2V22AC2- 2A2V22AC+  V22= V12+2gH(16)
V221+A2AC2-2A2AC+1= V12+2gH(17)
V222AC2+A22-2ACA2AC2= V12+2gH(18)
V22=AC2(V12+2gH)2AC2+A22-2ACA2(19)
V2=AC2(V12+2gH)2AC2+A22-2ACA2(20)
The discharge at section 2-2 in Figure 2 is given as
Qs=A2V2(21)
Substituting the value of V2 in equation 21,
The orifice equation becomes:
Qs=A2 X AC2(V12+2gH)2AC2+A22-2ACA2 (22)
Hence, Qs is the new model for the orifice discharge function.
The Alternative Form of Qs Model
Equation 22 can also be expressed in another form. Recall that;
HC= A2V2AC - V22g2=V222gA2AC-12(23)
HC=kV222g(24)
It has been established experimentally that K = 0.5
Hence,HC=V224g(25)
Substituting the value of HC into equation 6
V22=V12+2gH-V224g(26)
V22=V12+2gH- V222(27)
V22+ V222=V12+2gH(28)
Multiplying both sides of the equation by 2
2V22+ V22 =2V12+4gH(29)
3V22 =2V12+4gH(30)
V2 = 2V12+4gH3(31)
The discharge at section 2-2 in Figure 3 is given as,
Q=A2V2n
The orifice equation becomes:
Qs= A2 X 2V12+4gH3(32)
Equations 22 and 32 are the discharge through an orifice when the velocity at section 1 of the tank in Figure 3 and loss due to sudden contraction are both considered.
Qs = discharge through an orifice (m3/s),
A2 = Area at section 2 (orifice) (m2)
V1 = velocity at section 1 (m/s)
AC = Area of the vena contracta
VC = Velocity at the vena contracta
H = Elevation above the datum point.
g = gravitational acceleration.
3.2.2. Experimental Measurement of Discharge (Qe) Through a Circular Orifice
In the experimental phase of this study, a cylindrical reservoir of diameter 550mm was filled with water to the brim. An orifice of diameter 20mm and vena contracta diameter of 15mm were created on the cylindrical reservoir and were ascertained using a 0-25mm ranged vernier caliper. At varying pressure heads (H) above the orifice, the water flow was simulated to pass through the orifice into another cylindrical reservoir with a capacity of 60 liters. The time taken for the water to flow through the orifice and vena contracta sections into a 60-liter capacity reservoir and the volume of water collected into the reservoir were respectively noted with a digital stopwatch and the calibrations of the cylinder. The water volumes of the first and second reservoirs were determined using Equation 33. The experimental discharge values through the orifice were then determined using Equation 34. Figure 3 presents the schematic view of the essential simulation points of the experiment.
V= πD2H4(33)
Qe=volume of water collectedflow time(34)
3.2.3. Mathematical Determination of Flow Velocities and Areas at Points/Sections 1, 2, and C
To apply the classical and newly developed models for orifice discharge calculations, some essential parameters at sections 1-1, 2-2, and C-C of the system need to be determined using their respective accurate models. These sections are displayed in Figure 4.
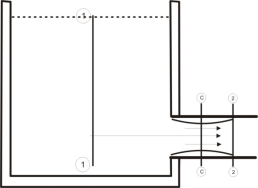
Figure 4. A schematic model for flow points parameter computation.
The areas of sections C-C and 2-2 were determined using the conventional equation of the area of a circle with C-C and 2-2 sectional diameters being 15mm and 20mm respectively. In addition, the velocities at sections 1-1 and C-C were respectively determined at varying pressure heads using equations 35 and 36.
V1=Radius of the cylindrical reservoir 1Required flow time to reach the start point of the orifice(35)
Vc=Length of the contracted orifice regionRequired flow time through the contracted region(36)
3.2.4. Thermodynamic Application to the Orifice Flow System
An insight into the thermodynamics parameters of the flow regime at the orifice is required to enable a more detailed comprehension of flow behaviors through the orifice system. The flow pressures, pressure drop at the orifice region, exit flow temperature, polytropic expansion work (W), and heat loss (Q) variables were computed using their respective thermodynamic models as expressed in equations 37-41. The initial flow temperature T1 was taken to be ambient (298K) since the flow is still laminar at this initial state, and the polytropic expansion/compression index at ambient conditions is 1.33. The heat loss during the flow operation for all the pressure heads considered was determined by applying the first law of thermodynamics equation to the orifice flow system.
Flowpressure,P= ωh(37)
Pressure drop=subsequent flow pressure-initial flow pressure, P (38)
T2T1 = P2P1n-1n(39)
W= mR(T1 -T2)n-1 = P1V1- P2V2n-1(40)
Q=W+ =W+CP(T2-T1)(41)
Where:
P = flow pressure (Pa),
T2 = exit temperature (K),
ω = specific weight of water (kN/m),
n = polytropic compression/expansion index (1.33),
V1= initial flow out volume (m3),
V2 = subsequent flow-out volume (m3),
W = polytropic work (kJ/kg),
Q = heat loss quantity (kJ/kg),
CP = specific heat value of water CpCv=1.33, Cof water=4.182kJ/kg.k
3.2.5. Statistical Evaluation of the Orifice Flow Models
To access the correctness and predictive accuracies of the classical and new orifice flow models, statistical indices such as mean bias error (MBE), mean percentage error (MPE), root mean square error (RMSE), Nash-Sutcliffe equation (NSE) and coefficient of correlation (r) were employed. These indices are vividly explained below.
The Mean Bias Error (MBE)
A low value of MBE attests or validates a good suitability for response prediction at any factor level considered. A negative value of MBE suggests an underestimation of the predicted value.
The relation used for its computation is given by equation 42.
MBE=1ni=1nSical-Simea(42)
Where:
n = number of data points (6),
Sical = calculated values of orifice discharge,
Simea = measured values of orifice discharge.
The Mean Percentage Error (MPE)
The correctness of a model is verified if its MPE value falls between -10% and 10%. MPE value is computed using equation 43 .
MPE%=1ni=1nSical-SimeasSimeas×100 (43)
The Root Mean Square Error (RMSE)
The smaller the value of RMSE the better the model’s estimation strength and accuracy. Its computational formula is given by equation 44 .
RMSE=1ni=1nsical-simeas212(44)
The Nash-Sutcliffe Equation (NSE)
The model’s efficiency and correctness are assured if and only if NSE is very close to one. The formula used to compute it as given by is given by equation 45.
NSE=1-i=1nSimea-Sical2i=1nSimea-S̅mea2(45)
Where: S̅mea = the mean measured value of solar intensity
The Coefficient of Correlation (COC)
The coefficient of correlation, r measures the degree of association or relationship between the measured values of orifice discharge and the calculated values of orifice discharge. Models with values of coefficient of correlation closer to one (1) or even one are regarded as efficient models well suited for response prediction at any factor level considered. Karl Pearson’s method was used to assess the developed model’s association with the measured values of orifice discharge. It was computed using the equation given thus.
r=XYX2Y2(46)
Where:
X = the difference between the measured values of orifice discharge and the mean of the measured orifice discharge.
Y = the difference between the calculated orifice discharge values and its mean value.
3.2.6. Application of Grand Canonical Ensemble to the Orifice Flow System
The grand canonical ensemble (also referred to as microcanonical ensemble) is a statistical ensemble that is used to represent the possible states of a mechanical system of particles that are in thermodynamic equilibrium (thermal and chemical) with a reservoir. This ensemble is applied to an open system as it allows the system to exchange energy (E) and particle mass (m) with its surroundings while keeping the volume (V), temperature (T), and chemical potential (μ) properties of the system constant. The orifice fluid flow system is an open system, hence the need to associate the model of orifice discharge to the descriptive grand canonical potential model expressed in equation 47 to understand the microstate behavioral functions that generate the observable macrostate characteristics of the system.
PV=kBTIn(Ω(E))(47)
From model 47, PV can be taken as absolute discharge, E is the energy possessed by the moving fluid, kB is the model relationship constant, Ω is the grand canonical potential defining the variable E, while V and T are fixed variables according to the grand canonical model. Using model 47, a functional model relationship as shown in equation 48 was formulated to study the performance characteristics of absolute discharge (Qabs) and fluid flow energy, E.
Qabs= kcE(48)
kc = a constant relating Qabs and E.
4. Result and Discussions
4.1. Orifice Volumetric Discharge: Measured, Classical and Statistical
The results of the orifice discharge values using the experimental (measured), classical model, and the new orifice discharge model derived using the statistical mechanics method are presented in Figure 5. Their respective numerical values are shown in Appendix (Table A1).
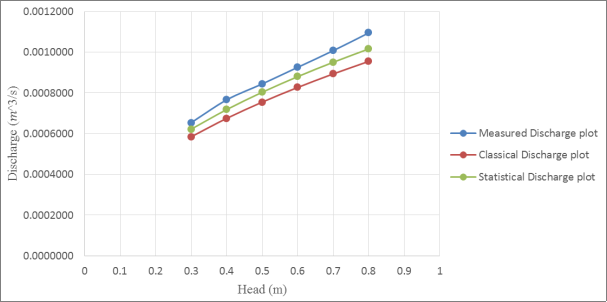
Figure 5. Graphical plot of orifice discharge against pressure heads using experimental, classical, and statistically derived models.
From Figure 5, it can be seen that the new orifice discharge model that was developed using a statistical thermodynamics approach by considering certain micro-based variables like velocity at section 1-1 and head loss due to sudden expansion/contraction at section 2-2 compared more favorably with the experimentally gotten orifice discharge values than the classical-based orifice discharge model. Also, the discharge values for both models could be observed to increase as the pressure head increases. Therefore, through a robust consideration of these micro-based variables, an enhanced macro-based orifice discharge estimation model was developed.
4.2. Thermodynamics Results: Classical and Statistical
In Figures 6-9, some thermodynamical variables that describe the micro-behaviors of the fluid flow system that resulted in the observable macro-behaviors are displayed. The effect of flow pressure on some thermodynamic variables (polytropic flow work, heat absorption, and temperature at the exit point) is illustrated in Figure 6.
From Figure 6, the heat absorption parameter and temperature at the exit point could be observed to increase as the flow pressure increases. Also, the heat values were all positive attesting that the flow system absorbed energy from its surroundings. The negative values of polytropic flow work imply that work was performed by the orifice flow system. In addition, figure 7 presents the effect of the flow head on these considered thermodynamic variables- heat absorption, exit point temperature, and flow work. These thermodynamic variables showed a direct variation with the flow head. This is because, the higher the flow head, the greater the momentum of the fluid which consequently results in higher fluid power leading to heat loss/gain, temperature increase, and energetic work performance.
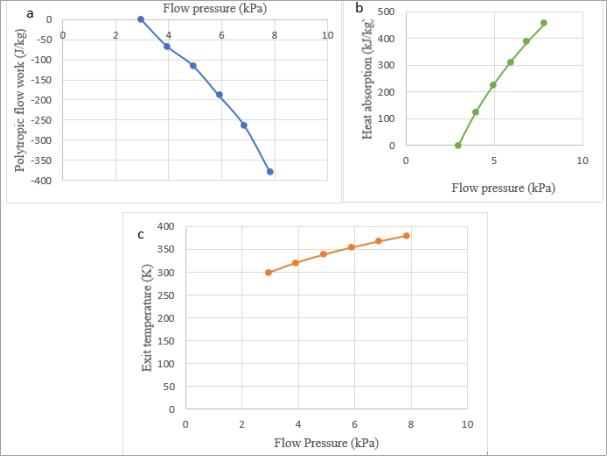
Figure 6. Effect of flow pressure on some thermodynamic variables (a) flow work (b) heat absorption and (c) exit point temperature.
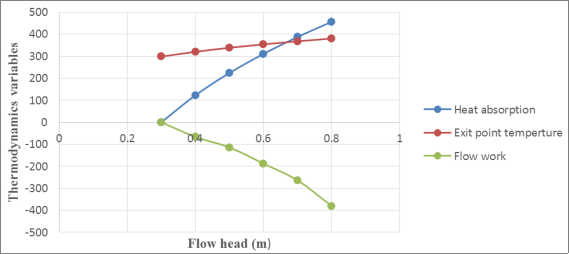
Figure 7. Effect of flow head on some thermodynamic variables (flow work (J/kg), heat absorption (kJ/kg), and exit point temperature (K)).
Furthermore, figure 8 delineates the relationship between the energy variable and flow pressure. The relationship between these variables could be observed to be linear, that is as the flow pressure increases, the energy of the flowing fluid increases as well. In addition, all the orifice discharge functions (Qs, Qc,  and Qe) had a direct linear relationship with flow energy, E as depicted in Figure 9 which therefore satisfied the grand canonical ensemble model displayed in equation 46. Moreso, equation 47 holds for the orifice discharge function as attested by the obtained values of Q and E. See Appendix (table A2) for the computed values of these thermodynamics variables.
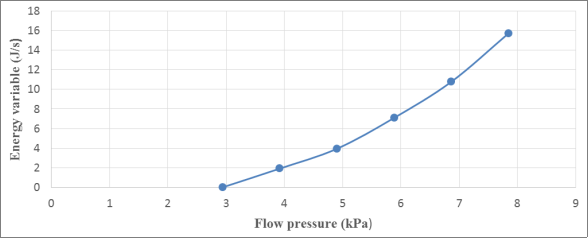
Figure 8. Illustration of the effect of flow pressure on the system’s energy.
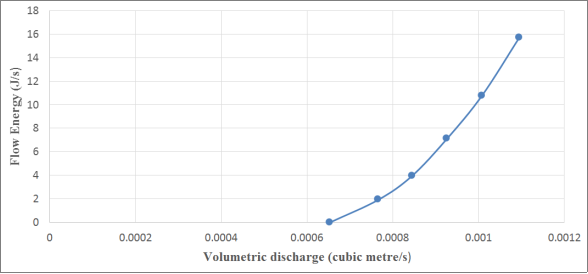
Figure 9. Graph illustrating a linear relationship between volumetric discharge and flow energy.
4.3. Statistical Evaluation of the Models-Qs,Qc and Qe
Table 1 displays the results of the statistical indices used to access the estimation performances of the classical and statistical-based orifice discharge models.
Table 1. Statistical Model Evaluation.

Models

MBE

MPE (%)

RMSE

NSE

R

Classical Model (Qc, )

-1.0042E-04

-11.30

5.814E-5

0.5114

0.999

Statistical Model (Qs)

5.032E-05

5.62

5.24E-05

0.873

0.999

From Table 1, the newly developed orifice discharge model outperformed the classical discharge model in terms of estimation performance of the volumetric flow rate through the orifice. The classical model gave a negative MBE value which suggests underestimation model property, its MPE value is off the range of -10 to 10, it has a higher RMSE value, its NSE value is not close to one, and its correlation value is very good. The statistical thermodynamics-derived model (Qs) completely satisfied the evaluation criteria of these statistical indices and also outperformed the classical orifice discharge model.
5. Conclusion
The application of statistical thermodynamics in the derivation of the orifice discharge function through a vivid consideration of some micro-based variables such as the velocity of fluid flow at the midpoint of the reservoir elevated to the mid-height of the orifice and the head loss due to sudden expansion well described the macro-behavior of the fluid flow system and also outperformed the classical orifice discharge model. In addition, the values of Pf, T2, W, Q, and E increased as the flow head increased. The polytropic work, W was negative, indicating that the system did some work. The positive values of Q and E indicated that the system absorbed energy from its environment during the fluid flow operation. Furthermore, all the orifice discharge functions (Qs, Qc,  and Qe) had a direct linear relationship with flow energy, E which therefore satisfied the grand canonical ensemble model.
Abbreviations

kc

A Constant Relating E & Qabs

A

Orifice Area

H

Pressure Head

g

Acceleration Due to Gravity

Cd

Discharge Coefficient

Qs

Statistical Model

Qc

Classical Model

Author Contributions
Obiora Clement Okafor: Conceptualization, Formal Analysis, Methodology, Software, Visualization, Writing – original draft, Writing – review & editing
Chinonso Hubert Achebe: Investigation, Methodology, Supervision, Writing – review & editing
Uchechukwu Ogbu Mbaka: Conceptualization, Investigation, Methodology
Funding
This work is not supported by any external funding.
Conflicts of Interest
The authors declare no conflicts of interest.
Appendix
Table A1. Numerical values of discharge using experimental, classical, and statistical techniques.

S/No

Head (m)

Volume (m3)

Time (s)

Discharge (Measured) (m3/s)

Discharge (Classical) (m3/s)

Discharge (Statistical) (m3/s)

1

0.3

0.02800

42.8

0.0006542

0.0005849

0.0006224

2

0.4

0.02659

34.7

0.0007663

0.0006754

0.0007187

3

0.5

0.02449

29

0.0008445

0.0007551

0.0008035

4

0.6

0.02454

26.5

0.0009260

0.0008272

0.0008802

5

0.7

0.02469

24.5

0.0010078

0.0008935

0.0009507

6

0.8

0.02650

24.2

0.0010950

0.0009552

0.0010164

Table A2. Thermodynamical variables of the orifice fluid flow system.

S/N

H (m)

T (s)

V (m3)

Pf (Pa)

Pd (Pa)

T2 (K)

W (J/kg)

Q (kJ/kg)

E (J/s)

1

0.3

42.8

0.028

2943

-

298.000

-

-

-

2

0.4

34.7

0.02659

3924

981

320.048

-66.470

122.508

1.9156

3

0.5

29

0.02449

4905

1962

338.268

-114.301

223.745

3.9414

4

0.6

26.5

0.02454

5886

2943

353.922

-187.995

310.691

7.0942

5

0.7

24.5

0.02469

6867

3924

367.721

-264.067

387.322

10.7783

6

0.8

24.2

0.0265

7848

4905

380.109

-380.509

456.063

15.7235

References
[1] R. K. Rajput, (2011). A textbook of fluid mechanics and hydraulic machines, 4th edition, New Delhi, S. Chand & Company Ltd. Pp. 297-306.
[2] L. T. Chang, and H. L. John, (2017). Statistical thermodynamics, 4th edition, NewYork, Hemisphere Publishing Corporation, p. 3.
[3] A. Gans, P. Aussillous, B. Dalloz, and M. Nicolas, “The effect of cohesion on the discharge of a granular material through the orifice of a silo,” EPJ Web of Conferences, vol. 249, p. 08014, 2021,
[4] A. Hotupan and A. Hadarean, “Experimental Determination of the Discharge Coefficient Through Circular Orifice in PVC Pipes,” Journal of Applied Engineering Sciences, vol. 10, no. 2, pp. 133–138, Nov. 2020,
[5] M. H. Assran, B. shenouda, and H. I. Mohamed, “Effect of orifice-meter shape on discharge coefficient and head loss through it,” Research Square Platform LLC, Jun. 2022. Accessed: Jan. 06, 2025. [Online]. Available:
[6] R. Cao, Y. Liu, and C. Yan, “A criterion for flow mechanisms through vertical sharp-edged orifice and model for the orifice discharge coefficient,” Petroleum Science, vol. 8, no. 1, pp. 108–113, Feb. 2011,
[7] C. D. Jan and Q. T. Nguyen, “Discharge Coefficient for a Water Flow through a Bottom Orifice of a Conical Hopper,” Journal of Irrigation and Drainage Engineering, vol. 136, no. 8, pp. 567–572, Aug. 2010,
[8] C. H. Achebe, O. C. Okafor, and E. N. Obika, “Design and implementation of a crossflow turbine for Pico hydropower electricity generation,” Heliyon, vol. 6, no. 7, p. e04523, Jul. 2020,
[9] O. C. Okafor and E. I. Echezona, “Mathematical Modelling of the Thermodynamical Functional Parameters of a Typical Hand-Driven Reciprocating Compressor,” The International Journal of Science & Technoledge, vol. 7, no. 9, Sep. 2019,
[10] V. O. Onyeka, C. C. Nwobi-Okoye, O. C. Okafor, K. E. Madu, and O. M. Mbah (2021). Estimation of global solar radiation using empirical models. Journal of Engineering Sciences, Vol. 8(2), pp. 11-19,
[11] O. M. Mbah, C. I. Madueke, R. Umunakwe, and C. O. Okafor, “Machine Learning Approach for Solar Irradiance Estimation on Tilted Surfaces in Comparison with Sky Models Prediction,” Journal of Engineering Sciences, vol. 9, no. 2, pp. G1–G6, 2022,
[12] H. O. Nnabuenyi, L. N. Okoli, F. C. Nwosu, and G. Ibe (2017). Estimation of global solar radiation using sunshine and temperature-based models for Oko town in Anambra State, Nigeria. American Journal of Renewable and Sustainable Energy, 3(2): 8-14.
[13] O. N. Akpenyi-Aboh, and O. C. Okafor (2024). Modeling the Solar Intensity of Asaba Town in Nigeria Using Response Surface Methodology and Machine Learning Techniques. American Journal of Mechanical and Industrial Engineering, 9(4), 63-74.
[14] E. Schrodinger, E. (1946). Statistical Thermodynamics. Dover Publications, Inc.
[15] Chukwuneke, J. L., Achebe, C. H., Okolie, P. C., Ajike, C. O. (2012). An application of statistical thermodynamics to an open flow system. International Journal of Scientific and Engineering Research, 13(5): 1-6.
Cite This Article
  • APA Style

    Okafor, O. C., Achebe, C. H., Mbaka, U. O. (2025). Application of Statistical Thermodynamics to Modelling Fluid Discharge Through a Circular Orifice System. American Journal of Mechanical and Industrial Engineering, 10(1), 1-11. https://doi.org/10.11648/j.ajmie.20251001.11

    Copy | Download

    ACS Style

    Okafor, O. C.; Achebe, C. H.; Mbaka, U. O. Application of Statistical Thermodynamics to Modelling Fluid Discharge Through a Circular Orifice System. Am. J. Mech. Ind. Eng. 2025, 10(1), 1-11. doi: 10.11648/j.ajmie.20251001.11

    Copy | Download

    AMA Style

    Okafor OC, Achebe CH, Mbaka UO. Application of Statistical Thermodynamics to Modelling Fluid Discharge Through a Circular Orifice System. Am J Mech Ind Eng. 2025;10(1):1-11. doi: 10.11648/j.ajmie.20251001.11

    Copy | Download

  • @article{10.11648/j.ajmie.20251001.11,
      author = {Obiora Clement Okafor and Chinonso Hubert Achebe and Uchechukwu Ogbu Mbaka},
      title = {Application of Statistical Thermodynamics to Modelling Fluid Discharge Through a Circular Orifice System},
      journal = {American Journal of Mechanical and Industrial Engineering},
      volume = {10},
      number = {1},
      pages = {1-11},
      doi = {10.11648/j.ajmie.20251001.11},
      url = {https://doi.org/10.11648/j.ajmie.20251001.11},
      eprint = {https://article.sciencepublishinggroup.com/pdf/10.11648.j.ajmie.20251001.11},
      abstract = {This study presents the application of statistical thermodynamics in modeling orifice discharge function. Micro-based variables such as the velocity of fluid flow at the midpoint of the reservoir elevated to the mid-height of the orifice and the head loss due to sudden expansion that was neglected in the classical discharge model were considered in the modeling operation. Bernoulli’s equation was used to determine the velocity model at the exit point of the orifice. Some classical thermodynamic models were used to compute certain parameters like: the flow pressure of fluid (water) (Pf), pressure drop (Pd), exit temperature, polytropic work (W), heat absorption/rejection (Q), and flow energy (E). The grand canonical ensemble which applies to open systems was used to establish a relationship between the flow discharge and energy variables according to the micro-based behavior of fluid flow through the orifice that generates the observable macro-flow behavior of a fluid. The discharge values obtained using the experimental (Qe), classical (Q(c,)) and statistically derived orifice discharge (Qs) models were compared and accessed statistically using the indices of: mean bias error (MBE), mean percentage error (MPE), root mean square error (RMSE), Nash-Sutcliffe equation (NSE), and coefficient of correlation (R). The results of the study showed that the new model that was derived using a statistical thermodynamics approach outperformed the classical orifice model as its MBE value of 5.032E-05, MPE of 5.62, RMSE of 5.24E-05, NSE of 0.873 and R of 0.999 were all better than that of the classical model having an MBE value of -1.0042E-04, MPE of -11.30 (underestimation), RMSE of 5.814E-05, and R of 0.999. In addition, the values of Pf, T2, W, Q, and E increased as the flow head increased. The polytropic work, W was negative, indicating that the system did some work. The positive values of Q and E showed that the system absorbed energy from its environment during the fluid flow operation. Furthermore, all the orifice discharge functions (Qs, Q(c) and Qe) had a direct linear relationship with flow energy, E which therefore satisfied the grand canonical ensemble model for the open system’s thermodynamic micro-variable description. Hence, the new orifice discharge model is recommended for the industry's volumetric flow rate measurement of Newtonian fluids.},
     year = {2025}
    }
    

    Copy | Download

  • TY  - JOUR
    T1  - Application of Statistical Thermodynamics to Modelling Fluid Discharge Through a Circular Orifice System
    AU  - Obiora Clement Okafor
    AU  - Chinonso Hubert Achebe
    AU  - Uchechukwu Ogbu Mbaka
    Y1  - 2025/01/24
    PY  - 2025
    N1  - https://doi.org/10.11648/j.ajmie.20251001.11
    DO  - 10.11648/j.ajmie.20251001.11
    T2  - American Journal of Mechanical and Industrial Engineering
    JF  - American Journal of Mechanical and Industrial Engineering
    JO  - American Journal of Mechanical and Industrial Engineering
    SP  - 1
    EP  - 11
    PB  - Science Publishing Group
    SN  - 2575-6060
    UR  - https://doi.org/10.11648/j.ajmie.20251001.11
    AB  - This study presents the application of statistical thermodynamics in modeling orifice discharge function. Micro-based variables such as the velocity of fluid flow at the midpoint of the reservoir elevated to the mid-height of the orifice and the head loss due to sudden expansion that was neglected in the classical discharge model were considered in the modeling operation. Bernoulli’s equation was used to determine the velocity model at the exit point of the orifice. Some classical thermodynamic models were used to compute certain parameters like: the flow pressure of fluid (water) (Pf), pressure drop (Pd), exit temperature, polytropic work (W), heat absorption/rejection (Q), and flow energy (E). The grand canonical ensemble which applies to open systems was used to establish a relationship between the flow discharge and energy variables according to the micro-based behavior of fluid flow through the orifice that generates the observable macro-flow behavior of a fluid. The discharge values obtained using the experimental (Qe), classical (Q(c,)) and statistically derived orifice discharge (Qs) models were compared and accessed statistically using the indices of: mean bias error (MBE), mean percentage error (MPE), root mean square error (RMSE), Nash-Sutcliffe equation (NSE), and coefficient of correlation (R). The results of the study showed that the new model that was derived using a statistical thermodynamics approach outperformed the classical orifice model as its MBE value of 5.032E-05, MPE of 5.62, RMSE of 5.24E-05, NSE of 0.873 and R of 0.999 were all better than that of the classical model having an MBE value of -1.0042E-04, MPE of -11.30 (underestimation), RMSE of 5.814E-05, and R of 0.999. In addition, the values of Pf, T2, W, Q, and E increased as the flow head increased. The polytropic work, W was negative, indicating that the system did some work. The positive values of Q and E showed that the system absorbed energy from its environment during the fluid flow operation. Furthermore, all the orifice discharge functions (Qs, Q(c) and Qe) had a direct linear relationship with flow energy, E which therefore satisfied the grand canonical ensemble model for the open system’s thermodynamic micro-variable description. Hence, the new orifice discharge model is recommended for the industry's volumetric flow rate measurement of Newtonian fluids.
    VL  - 10
    IS  - 1
    ER  - 

    Copy | Download

Author Information